Main Menu
- Home
- Product Finder
- Calibration Systems
- Calibration Services
- Digital Sensing
- Industrial Vibration Calibration
- Modal and Vibration Testing
- Non-Destructive Testing
- Sound & Vibration Rental Program
- Learn
- About Us
- Contact Us
Have you considered the often overlooked sensor specification: amplitude linearity? Linearity, defined quite simply, is a numerical value that expresses how much a sensor’s sensitivity changes with respect to the change in excitation amplitude. Linearity tests are commonly conducted for sensors with a relatively “low” sensitivity because these sensors generally experience more extreme measurement conditions. In the sound and vibration world, these are the sensors that are often used to capture high-energy events such as shock events for acceleration, and blast events for pressure. Due to the high variability in excitation that these sensors undergo, test and measurement engineers will often specify to continually quantify the performance of a sensor’s linearity during its recalibration cycle to ensure consistent results.
.png)
.png)
A linearity calibration of a typical piezoelectric sensor is most often accomplished via step or pulse excitation of a reference and test transducer through incrementally spaced amplitudes.
Often, several pulses are taken for a given test level and averaged to represent a single point. As a result, compared to typical sine-wave calibration techniques, transient calibration methods require much more user labor. Sine wave linearity calibrations are usually reserved for higher sensitivity sensors. Or linearity calibrations can be used in applications where only low amplitude linearity is of concern, as the maximum test amplitude is limited by the cooling capability of the electrodynamic shaker used for testing (usually limited to 10’s of g’s, orders of magnitude less than impulse methods). Regardless of the input method, the result of this calibration is typically visualized in the form of an output vs amplitude plot as shown below.
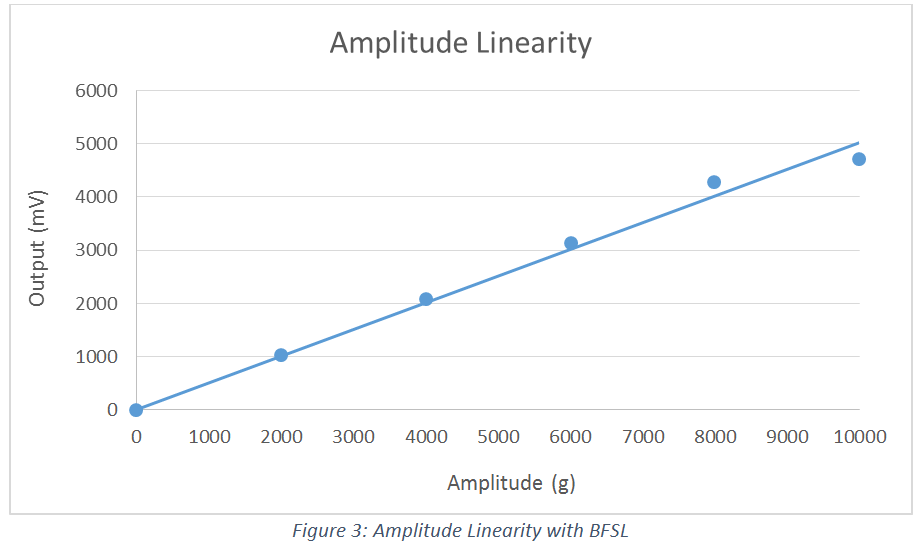
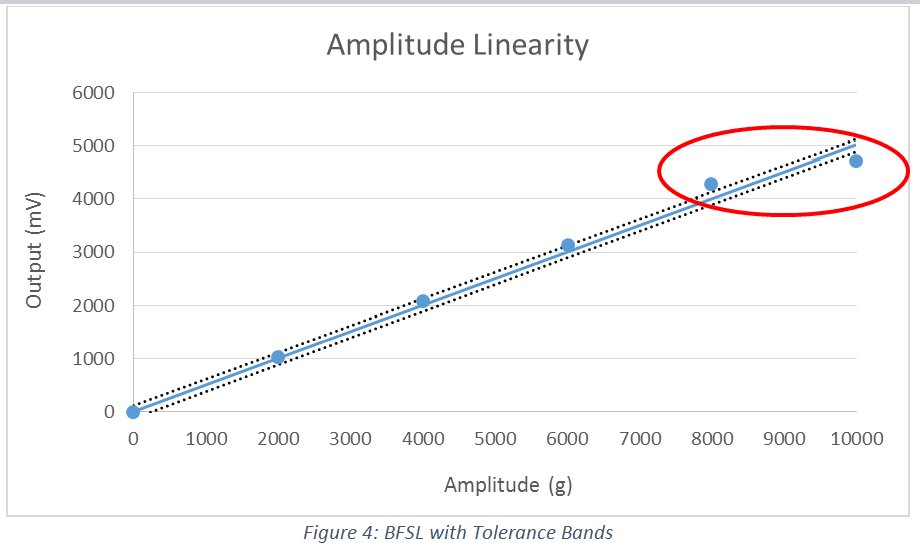
The line fit through the data set is a zero-based, least squares best fit straight line (y=mx+0) for dynamic sensors and non-zero-based, least squares best fit straight line (y=mx+b) for DC responding sensors. The slope of this line (rise over run, mV/g in this case) can be used to express the sensitivity of the sensor through its amplitude range. The linearity for the sensor is then expressed as the deviation of the point that is the maximum distance from the best fit straight line divided by the FS value to get a percent. Adding boundary lines with the same slope having Y offsets equal to the percentage of full-scale output can be used to help visualize the tolerance. For piezoelectric quartz sensors, this tolerance is quite small (typically less than +/-1%).
Depending on the manufacturer specifications, linearity is sometimes expressed as a percentage of full-scale output (e.g. <2.5%), or per portion of the full-scale output (ex:<0.5% per 1000 g, 0-5000 g). In the case of the latter, the percentage must be multiplied by the number of portions equal to the full-scale output in order to see the full linearity specification. For example 0.5*5=2.5% (per 5000 g).
Resources: